The Provocateur: Everything you know about digital reach is wrong
In its essence, an effective media plan ensures that you reach as much of the right audience as possible in the most cost-effective way. And don’t get me wrong, driving engagement, building affinity, and delivering on conversions are also crucial objectives, but they deliver much better results when they are underpinned by an approach that focuses on reaching the right audience, in the most cost-effective way.
Digital channels offer great reach. But let me be frank: Everything you know about digital reach is wrong. Social inventory and programmatic display and video bought through the open exchange deliver high impressions, high reach, and are relatively cheap per thousand. As a result, brands and agencies often revert to these options rather than more premium and costly inventory because of the perceived low cost and high reachability that they offer. This, however, is misguided.
Viewability and reach
Here’s the problem. Some social and open exchange inventories have low viewability figures. In some instances, viewability is as low as 4% for specific social placements. What this means is that only 4% of the huge audience you reached have viewed your ad (and, let’s be honest, the standard for what counts as a valid view is questionable).
I decided to do a bit of an exercise, comparing social, open exchange and premium inventory reach figures. I used a standardised budget across all channels, with CPMs that reflect industry averages.
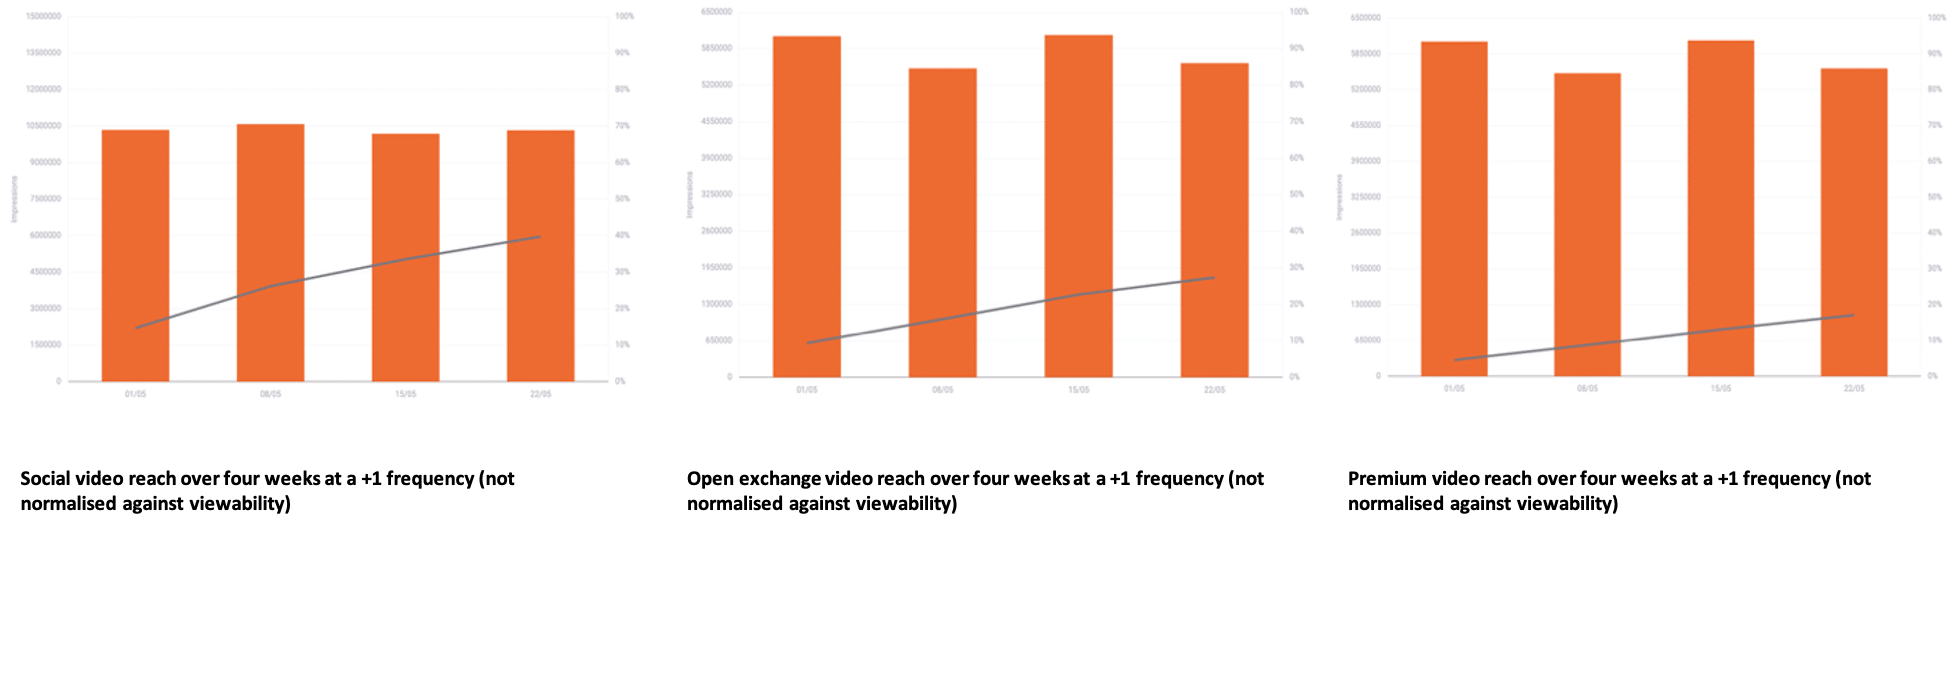
When comparing reach over a period of four weeks at a +1 frequency (not normalised against viewability metrics), social video delivers 40% reach, followed by open exchange video at around 30% and premium video at around 20%.
At a first glance, most media planners would look to increase investment in social video and open exchange video, because it delivers higher reach numbers in a like-for-like budget scenario.
But this is not a like-for-like situation. Even though budget, period and frequency are the constants, with channel (and essentially CPM) being the only variables, there is a missing variable that hasn’t been considered. And that variable is viewability.
What is viewability? Viewability refers to the percentage of digital ads served that are being viewed by a human being. The reason we measure viewability is to ensure that we optimise towards quality inventory in environments that are highly viewable. This ensures that our ads are being seen and not lost below the fold or on a page that doesn’t end up loading.
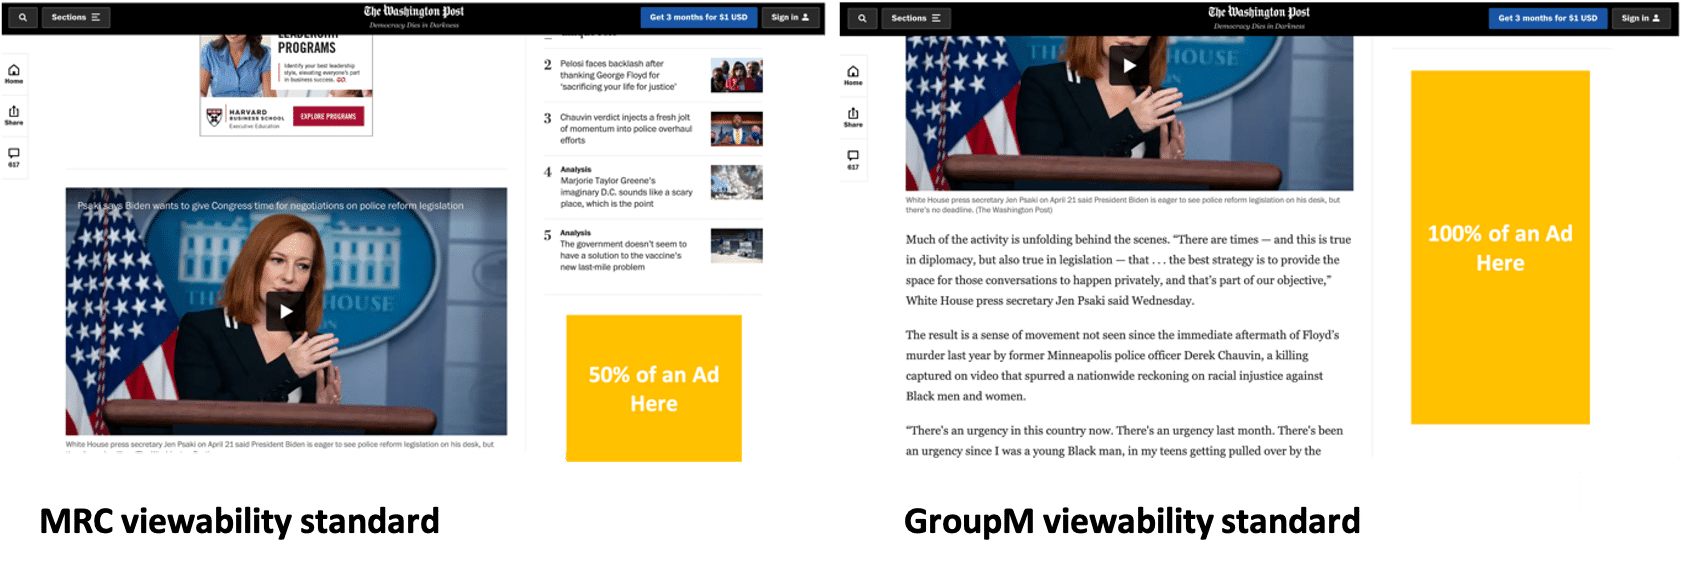
Within the industry there has been a lot of discussion around when an advert is classified as viewable. In 2014, the Media Rating Council released their viewability standard. According to this standard, a display ad is deemed viewable when 50% of the pixels are being seen for one continuous second, and a video ad is deemed viewable when 50% of the pixels are viewed for two continuous seconds.
At GroupM, we decided that this standard isn’t good enough for our clients, so we developed our own. According to the GroupM standard, a display ad is deemed viewable when 100% of the pixels (fully on screen) are viewed for one continues second by valid human traffic. A video ad is deemed viewable when 100% of the pixels (fully on screen) are viewed for half of the duration (with a 15 second cap).
This approach suggests that reach isn’t good enough if it’s not viewable. When planning based on reach, it’s important to normalise reach forecasts against viewability to get a true reflection of quality (and viewable) reach. To illustrate this, I’ve taken the same scenario as above, but normalised the reach numbers against the viewability standards for each channel, as benchmarked by internal viewability standards measured through Integral Ad Science (IAS), Moat and DoubleVerify tools.
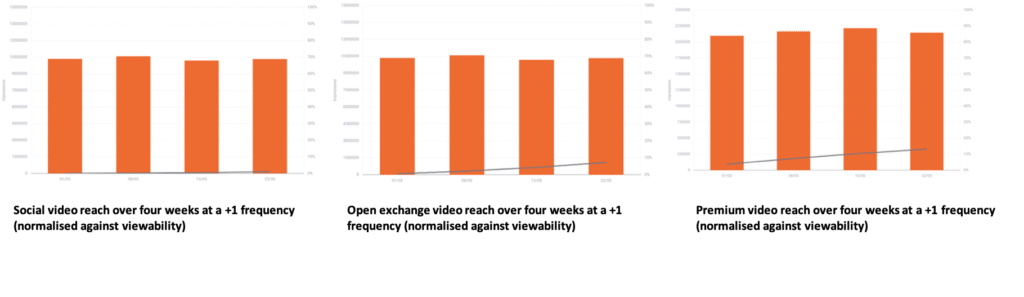
When comparing reach over a period of four weeks, at a +1 frequency that is normalised against viewability metrics, social video reach drops from 40% to around 2%, open exchange video reach drops from 30% to around 9%, and premium video reach drops from 20% to around 15%.
Rethinking reach campaigns
If you were to give the normalised and non-normalised reach numbers to a media planner, they would easily be able to spot the differences. So where does this leave us? Does it mean that we shouldn’t be investing anything into social or the open exchange? What if social still drives conversions?
The purpose of this is not to persuade you to get rid of social or open exchange inventories, but rather to demonstrate that a diversified mix of digital channels is key to maximising reach.
Furthermore, there are ways to improve viewability on some of these channels. On social, it is key to consider higher viewable placements, such as static, versus lower viewable placements, such as video. When you do use video placements, shorter formats will get higher viewability than longer formats.
Programmatic buys on the open exchange can also deliver higher viewability if you implement some basic in-platform viewability hygiene such as optimising against a viewable CPM.
But most importantly, ensure that you invest in measuring viewability through partners such as IAS, Moat or DoubleVerify. Not only does this help planners to select channels with a higher viewability, but it allows us to hold channels accountable on behalf of our brands.
 Shaun Frazao, Head of Digital, Wavemaker Sub-Saharan Africa.